
CloudWatch Logs Output
Sending Dash Compliance Events To Cloudwatch
Dash allows teams to extend compliance by connecting Dash compliance events into audit logging and SIEM solutions. Dash customers can collect compliance logs for further analysis in Cloudwatch or solutions such as Elasticsearch and Splunk. Users can also trigger Lambda functions and other AWS functions using Dash’s output to Cloudwatch Events.
What Will You Need?
Dash ComplyOps v1.5.0 or greater – See how to update to latest version of Dash
About 5 minutes of time
Instructions
In Dash ComplyOps, navigate to Settings→ Notification Settings
The page should look like this:
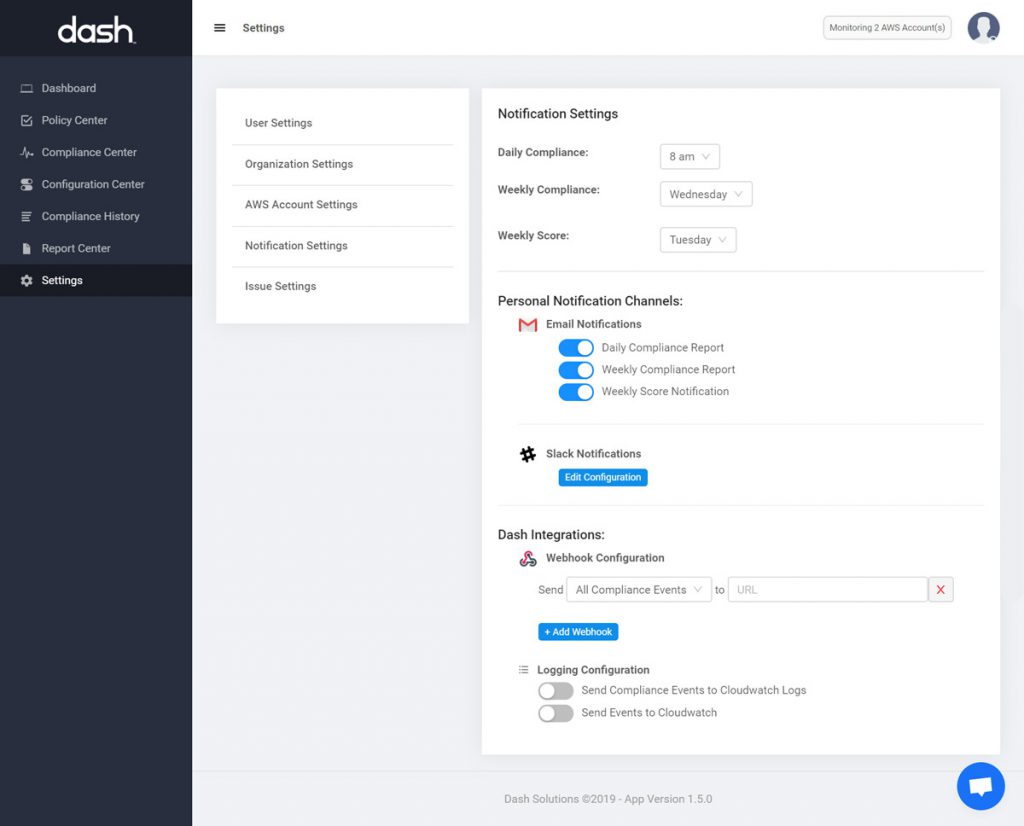
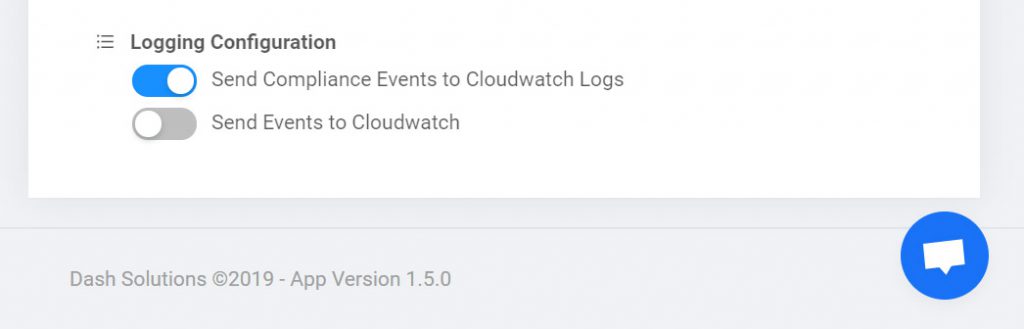
3. Under the Logging Configuration section of the page, make sure “Send Compliance Events to Cloudwatch Logs” is enabled like shown below.
Viewing Dash Compliance Issues In Cloudwatch
After enabling this option, compliance events from Dash will stream into Cloudwatch Logs on a daily basis.
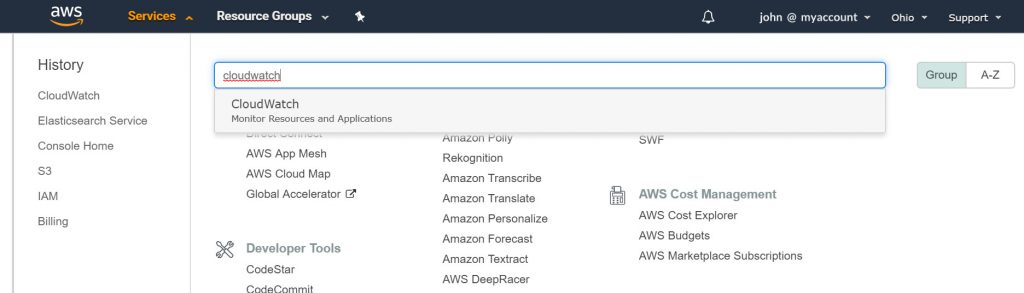
To access Dash logs, login to the AWS Console -> Click the Services tab -> Navigate to Cloudwatch
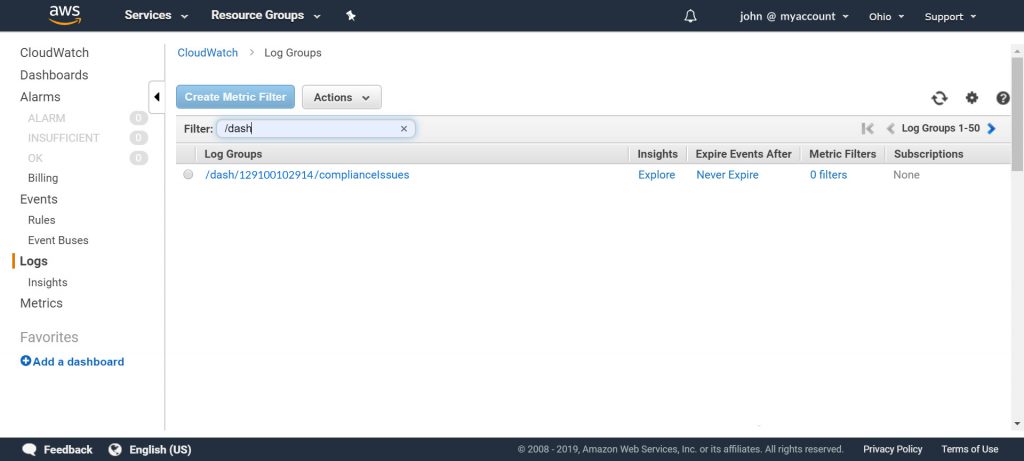
3. Click “Logs” in the left sidebar.
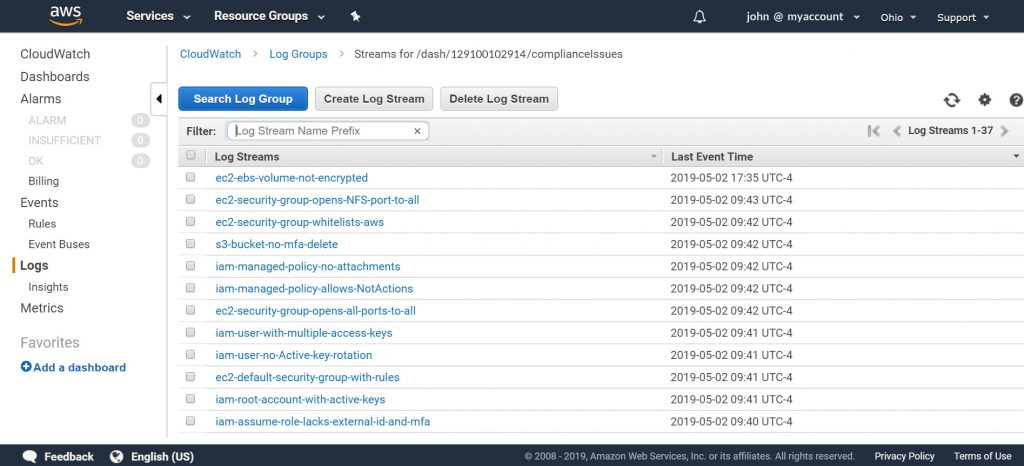
4. In the Filter Box, type “/dash” and press enter. You should see Dash Log Groups based on your AWS account ID, similar to the image below.
5. You can click on an individual Log Group to view Log Streams and see compliance event types like below.
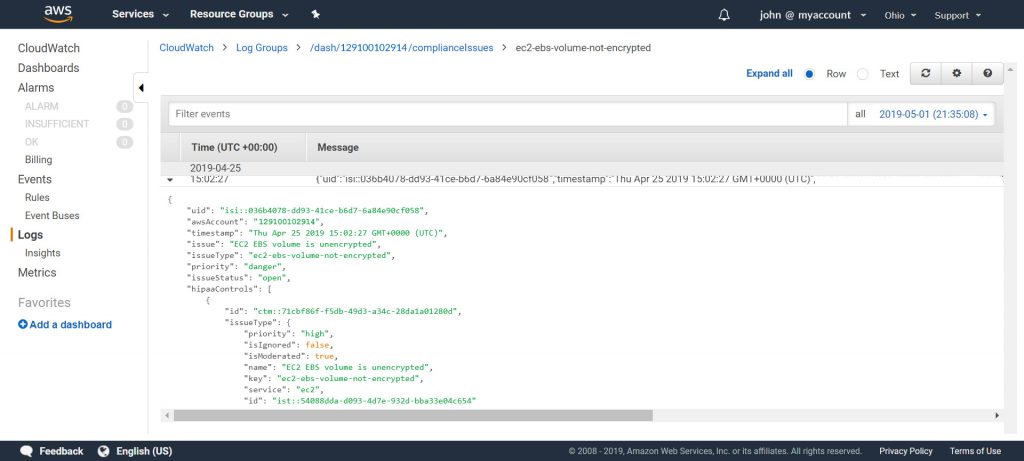
6. Users can view individual logs by clicking on an individual event type.
Connecting Cloudwatch Logs To Other Logging Solutions
Once you have enabled sending Dash Compliance logs to Cloudwatch, your team can connect Dash compliance data into other logging solutions and SIEMs such as AWS Elasticsearch, Logstash and Splunk.
Read Our Other Tutorials For Sending Dash Compliance Events to: